
Task Tracker Dashboard
A production-grade, fully-tested React + TypeScript task tracker dashboard with comprehensive functional coverage and performance validation. Features interactive charts for status and category distribution, advanced OR/AND filter logic across charts, sortable paginated table, localStorage state persistence, MSW mock backend with 200 tasks, and over 75% test coverage. Built with React 18, TypeScript, Tailwind CSS, Redux Toolkit, Recharts, Jest, and Vite following Atomic Design principles.
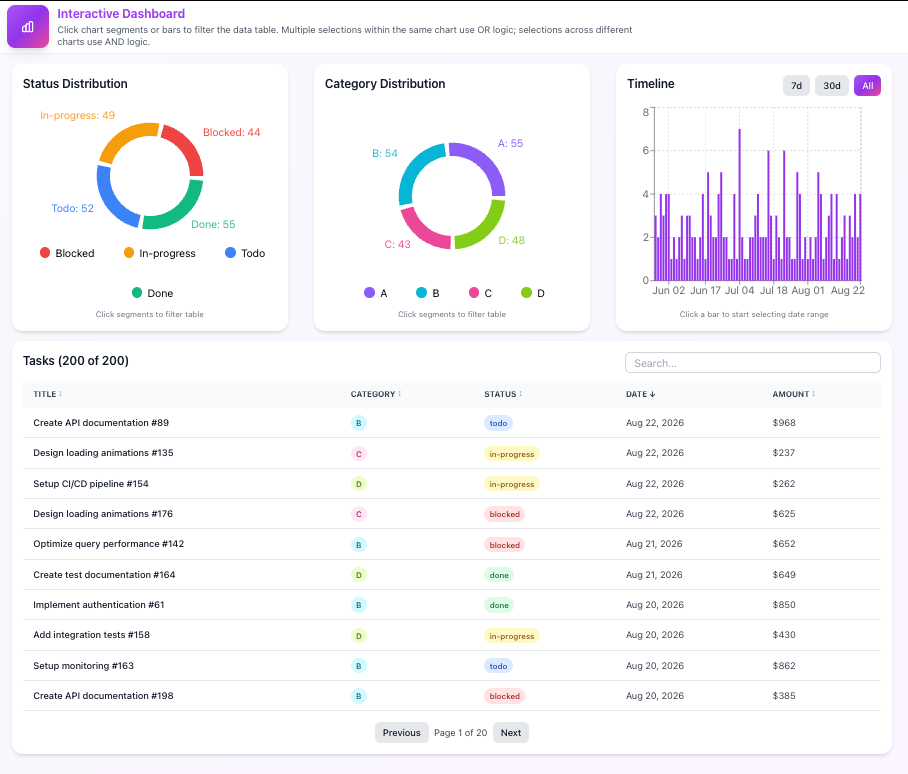
Managing tasks at scale presents a genuine engineering challenge: teams need real-time visibility into workload distribution, flexible filtering to surface the right data, and a UI that remains performant as the dataset grows. Task Tracker Dashboard was built to address exactly these concerns — delivering a production-grade web application that handles 200 synthetic tasks while keeping interactions fast, predictable, and thoroughly tested.
Key Features
The dashboard centres on two interactive Recharts visualisations — a status distribution chart and a category breakdown chart — that update in real time as filters are applied. A distinctive OR/AND filter logic layer lets users compose queries across both charts simultaneously, toggling between inclusive (OR) and strict (AND) matching to drill into exactly the task segments they care about. Below the charts, a sortable, paginated table presents the full task list with column-level sorting and configurable page sizes, ensuring the interface scales gracefully regardless of dataset volume. All filter and sort state is persisted to localStorage, so users return to exactly where they left off after a page refresh.
Technology Stack
The project is built on React 18 with TypeScript throughout, providing end-to-end type safety from the Redux store slices to the component props. Redux Toolkit manages global state — including active filters, sort configuration, and pagination — keeping state transitions explicit and easily testable. Tailwind CSS drives the styling layer, enabling a consistent, responsive design without a runtime CSS-in-JS overhead. Recharts powers the data visualisations, and Vite serves as the build tool, delivering near-instant hot module replacement during development and optimised production bundles.
MSW Mock Backend & Atomic Design Architecture
Rather than relying on a live API, the application uses Mock Service Worker (MSW) to intercept network requests at the service-worker level and return a dataset of 200 synthetically generated tasks. This approach mirrors real-world API behaviour — including latency simulation and error scenarios — without requiring a backend deployment, making the project fully self-contained and portable. The codebase follows Atomic Design principles, organising components into atoms, molecules, organisms, and pages. This hierarchy enforces clear separation of concerns, simplifies component reuse, and makes the codebase straightforward to navigate and extend.
Testing Strategy
Quality assurance is a first-class concern. The test suite is written with Jest and achieves over 75% coverage across statements, branches, functions, and lines. Tests span unit coverage of Redux selectors and reducer logic, integration tests for filter composition and pagination behaviour, and component-level rendering tests that validate chart output and table interactions. The MSW handlers are reused in the test environment, ensuring that data-fetching logic is exercised against realistic mock responses rather than trivial stubs. This comprehensive coverage gives confidence that refactors and new features can be introduced without silent regressions.
What the 'OR/AND' filter logic actually does
The status chart and category chart don't just filter the same list two different ways — each one is computed from a selector that deliberately excludes its own dimension's filter. selectStatusDistribution reads from selectTasksExcludingStatusFilter, which still applies the category, date-range, and search filters, but not the status one; selectCategoryDistribution mirrors that for category. So selecting "blocked" on the status chart doesn't just filter the category chart down to blocked tasks — it keeps showing every status's category breakdown, letting you compare what's blocked against what's everywhere else without losing the view of the whole. Both selectors are memoized with Reselect's createSelector, so a filter change unrelated to a given chart's own dimension doesn't force it to recompute.